
A tornado event (either a single tornado or a cluster of tornadoes that form during a single storm system) occurs in the United States resulting in direct economic losses of or greater than $100 Million. The methodology for determining clusters can be found below.
In the following table, note that the low and high likelihoods do not correspond to the low and high impacts. In addition, low and high impacts are not necessarily correlated with each other between different impact categories.
| Category | Description | Metric | Low | Best | High |
|---|---|---|---|---|---|
| Health and Safety | Fatalities | Number of Fatalities [3] | 0 [5] | 0 [6] | 0 [7] |
| Injuries and Illnesses | Number of Injuries or Illnesses [3] | 0[8] | 2[9] | 400[10] | |
| Economic | Direct Economic Loss | U.S. Dollars (2011) [3] | $103 million [4] | $450 million | $4.7 billion |
| Social | Social Displacement | People Displaced from Home 2+ Days | N/A | ||
| Psychological | Psychological Distress | Qualitative Bins | See text | ||
| Environmental | Environmental Impact | Qualitative Bins | N/A[5] | ||
| LIKELIHOOD | Frequency of Events | Number of Events per Year [6] | 0.63 | 2.9 | 7 |
The most destructive and deadly tornadoes occur from supercells -- which are rotating thunderstorms with a well-defined radar circulation called a mesocyclone (supercells can also produce damaging hail, severe non-tornadic winds, unusually frequent lightning, and flash floods). [7] Although tornadoes appear throughout the world, the continental United States is subjected to more tornado events than any other country. On average, there are 1,300 tornadoes that hit the United States each year, of which an average of 140 (or approximately 10%) are significant (rated as EF2 or higher on the enhanced Fujita scale). [8] Tornadoes are more common in the United States than in any other country because of the interactions between cold fronts coming from Canada that collide with warm fronts that hit the central United States via the Gulf of Mexico. This collision generally centers over the central and southeastern portions of the United States, and there is a higher frequency of tornadoes that strike these regions.
Nevertheless, tornadoes occurred in all 50 states, the District of Columbia [9] and Puerto Rico between 1996 and 2011.
For the purposes of the Strategic National Risk Assessment, the SNRA team analyzed tornado events that resulted in $100 million or more in economic damage. From 1996 to 2011, there were 46 tornado events that met this criterion. Of these 46 events, 44 were outbreaks that included more than one tornado. These outbreaks were determined using a clustering method to aggregate the fatality, injury and economic impacts of tornadoes that occurred within one day and 150 miles of at least one other tornado.
The economic threshold highlights 46 events during the time frame. Figure 1 outlines data on the tornado events that met the criteria of the $100 million threshold.
Note that the tornadoes captured by this threshold represent only 14% of all tornadoes in the data set. However, those 14% of tornadoes are responsible for 72% of all fatalities, 58% of all injuries and 75% of all economic damage from all tornadoes during the 1996 -- 2011 timeframe (see Figure 1).
Figure 1. Percentage of tornadoes in the data set that meet the threshold and the proportion of associated impacts within and outside of the threshold
When appropriate (i.e., when temporal and spatial criteria were met) individual tornadoes were clustered into multi-tornadic outbreak events. This was done because DHS is responsible for responding to a single destructive event, without separating out damage that comes from different tornadoes. The SNRA team chose to cluster tornadoes using spatial and temporal clustering, as this facilitated analysis on the aggregated total of fatalities, injuries and economic damage caused by tornadoes in a storm system, not just an individual storm. Through the use of this threshold, the SNRA team was able to capture the most damaging and dangerous storms from the data set.
In order to cluster the tornadoes, the team created a model that clusters tornado events if certain criteria are met. The data set has been programmed to cluster tornadoes if they meet the following two conditions: 1) the events fall within a one day window [10], [11] and 2) the events are located within 150 miles of another event. [12]
It is important to note that the SNRA team elected to not make the Enhanced Fujita (EF) Scale (formerly known as the Fujita (F) Scale) rating a threshold for clustering. A powerful storm (EF4-- EF5) could hit a forest or a field, causing relatively little damage. At the same time, a weak storm (EF0 -- EF2) could cause significant economic damage or loss of life if it struck a densely populated area. Due to the inconsistency, the SNRA team felt it was important to include all tornadoes regardless of the EF scale rankings in the data set.
During this risk assessment, temporally and spatially associated events were identified as "tornado clusters." There are two main reasons why the SNRA team created a model to cluster tornadoes as opposed to relying on external sources:
The specific spatial and temporal parameters in the clustering algorithm were calibrated using publically available news and weather reports published on days of tornado outbreaks. Before clustering the data, the SNRA team checked its main data source, the National Weather Service�s (NWS) Storm Prediction Center (SPC) database, for consistency. Several adjustments were incorporated in the SNRA data set:
To create the clustering model, a program was written by the SNRA team using MATLAB. The base of the program was previous work that was done to support research into clusters of floods for the SNRA. The following parameters were built into the model and used to define the criteria for each cluster:
The steps performed by the clustering algorithm proceeded as follows:
The final data set that was put into the clustering model included individual tornadoes that occurred in the United States [17] from 1996 to 2011. The SNRA team analyzed 20,755 tornadoes that occurred during this timeframe. Using the clustering methodology, the final number of tornado clusters was 4,597. Of these clusters, 2,206 clusters represented more than one tornado while the remainders were individual tornadoes that did not cluster with any other tornadoes in the data set. Once the clusters were formed, they were extracted and analyzed in Microsoft Excel using advanced database tools. In Microsoft Excel, the $100 million threshold was applied. Of the 2,206 clusters established, 46 clusters were analyzed as SNRA level events (Tables 1, 2).
Table 1. Results for Tornado Events Resulting in $100 Million or More in Economic Damage
| Number of Events | 46 |
| Number of Tornadoes | 2,813 |
| Number of Fatalities | 1,025 |
| Number of Injuries | 11,367 |
| Total Economic Damage | $20.7 billion [18] |
| Proportion of Tornadoes Above the Threshold from the Entire Data Set | 14% |
| Proportion of Fatalities Represented From Entire Data Set | 72% |
| Proportion of Injuries Represented From Entire Data Set | 58% |
| Proportion of Economic Damage Represented From Entire Data Set | 75% |
| Number of Outbreaks (More than One Tornado per Event) | 44 |
| Number of Individual Storms | 2 |
| Average Number of Storms per Outbreak | 64 [19] |
Table 2. SNRA Tornado Clusters
| Start Date | End Date | States Affected (primary or all) | Fatalities | Injuries | Economic | Number of Tornadoes in Cluster | Max EF Scale |
|---|---|---|---|---|---|---|---|
| 4/18/1996 | 4/20/1996 | IL, IN, KY | 1 | 118 | $141,559,990 | 75 | 3 |
| 4/21/1996 | 4/22/1996 | OK, AR | 4 | 112 | $220,328,680 | 33 | 3 |
| 5/27/1996 | 5/28/1996 | KY | 0 | 11 | $145,888,600 | 15 | 4 |
| 5/25/1997 | 5/28/1997 | TX | 28 | 35 | $182,873,600 | 95 | 5 |
| 7/2/1997 | 7/2/1997 | Ml | 2 | 98 | $178,990,000 | 15 | 3 |
| 2/2/1998 | 2/2/1998 | FL | 0 | 0 | $310,693,200 | 6 | 2 |
| 2/22/1998 | 2/23/1998 | FL | 42 | 259 | $147,982,920 | 11 | 3 |
| 3/29/1998 | 3/29/1998 | MN | 1 | 2 | $221,931,600 | 16 | 3 |
| 4/8/1998 | 4/8/1998 | AL, FL | 35 | 286 | $418,554,000 | 9 | 5 |
| 4/15/1998 | 4/16/1998 | TN, KY, AR | 12 | 152 | $210,204,360 | 58 | 5 |
| 5/31/1998 | 6/4/1998 | NY, PA | 3 | 189 | $163,645,920 | 72 | 4 |
| 1/21/1999 | 1/22/1999 | TN, AR | 9 | 162 | $122,322,150 | 129 | 4 |
| 4/9/1999 | 4/9/1999 | OH | 4 | 67 | $121,837,500 | 8 | 4 |
| 5/3/1999 | 5/5/1999 | OK, TX, KS | 47 | 861 | $1,882,923,300 | 107 | 5 |
| 8/11/1999 | 8/11/1999 | UT | 1 | 80 | $229,500,000 | 1 | 2 |
| 3/12/2001 | 3/12/2001 | TX | 0 | 0 | $387,350,000 | 1 | 1 |
| 9/24/2001 | 9/24/2001 | MD | 2 | 59 | $133,579,870 | 8 | 4 |
| 10/9/2001 | 10/9/2001 | OK | 0 | 10 | $128,351,280 | 19 | 3 |
| 4/28/2002 | 4/28/2002 | MD, OH | 3 | 143 | $230,312,500 | 21 | 4 |
| 11/9/2002 | 11/11/2002 | OH, MS, TN, AL, OH, PA | 32 | 284 | $200,260,000 | 77 | 3 |
| 5/4/2003 | 5/11/2003 | OK, TN, MO, IL, KS, KY | 36 | 605 | $1,027,066,760 | 315 | 4 |
| 9/15/2004 | 9/18/2004 | VA, GA, FL | 7 | 41 | $102,474,470 | 118 | 3 |
| 4/6/2005 | 4/6/2005 | MS | 0 | 10 | $599,850,350 | 23 | 3 |
| 11/6/2005 | 11/6/2005 | KY | 24 | 243 | $103,201,000 | 3 | 3 |
| 4/2/2006 | 4/2/2006 | AR, KY, TN, IL | 27 | 348 | $214,368,000 | 67 | 3 |
| 4/7/2006 | 4/8/2006 | TN, AR, GA, KY | 10 | 144 | $116,824,960 | 55 | 3 |
| 2/2/2007 | 2/2/2007 | FL | 21 | 76 | $235,444,320 | 4 | 3 |
| 3/1/2007 | 3/2/2007 | AL, GA | 19 | 97 | $449,241,120 | 35 | 4 |
| 5/4/2007 | 5/9/2007 | KS | 14 | 89 | $289,417,320 | 139 | 5 |
| 2/5/2008 | 2/6/2008 | TN, MS, AL, AR, KY | 44 | 286 | $407,381,520 | 85 | 4 |
| 5/10/2008 | 5/11/2008 | OK, AR, GA, MO | 24 | 400 | $215,957,040 | 72 | 4 |
| 5/22/2008 | 5/24/2008 | CO, KS | 3 | 87 | $163,545,200 | 113 | 4 |
| 5/25/2008 | 5/25/2008 | IA | 9 | 73 | $106,229,760 | 8 | 5 |
| 4/9/2009 | 4/10/2009 | AR | 3 | 44 | $162,021,300 | 23 | 3 |
| 4/10/2009 | 4/10/2009 | TN, GA, SC | 2 | 102 | $132,940,500 | 63 | 4 |
| 4/23/2010 | 4/25/2010 | LA | 10 | 202 | $451,956,790 | 37 | 4 |
| 6/3/2010 | 6/6/2010 | IL, Ml, OH | 8 | 75 | $277,366,640 | 51 | 4 |
| 7/22/2010 | 7/23/2010 | IA | 0 | 0 | $773,813,250 | 3 | 1 |
| 12/30/2010 | 12/31/2010 | OK, MO, IL | 9 | 29 | $113,346,350 | 25 | 3 |
| 4/4/2011 | 4/4/2011 | MS | 0 | 3 | $508,137,000 | 20 | 2 |
| 4/14/2011 | 4/16/2011 | AL, AR, MS, OK | 12 | 107 | $155,469,000 | 116 | 3 |
| 4/16/2011 | 4/16/2011 | NC | 24 | 456 | $401,266,000 | 54 | 3 |
| 4/22/2011 | 4/28/2011 | AL, GA, MS, TN, VA | 316 | 3125 | $4,676,142,000 | 382 | 5 |
| 5/20/2011 | 5/26/2011 | MO, OK, IL, AR, KS | 173 | 1545 | $2,839,996,000 | 188 | 5 |
| 5/21/2011 | 5/23/2011 | MN, WI | 1 | 52 | $190,982,000 | 34 | 2 |
| 6/1/2011 | 6/1/2011 | MA | 3 | 200 | $227,600,000 | 4 | 3 |
The SNRA team used the following assumptions to estimate impacts caused by a tornado event:
Single tornadoes have the potential to cause a large loss of life. On May 22, 2011, the deadliest single tornado to strike the United States since 1947 tore through Joplin, MO (population 50,000). The tornado was rated as a strong EF5, and there was extensive loss of life, injuries, economic loss and psychological impacts. NOAA�s SPC registered 158 fatalities and 1,150 injuries that were directly related to the single tornado. The final economic cost of the Joplin tornado was found to be $2.8 billion. [23], [24] As a result of the tornado, the governor of Missouri issued a State of Emergency due to the loss of critical infrastructure in the city and the need to rapidly deploy federal, state and local resources in response to the disaster. The Joplin tornado was the most significant tornado in a tornado outbreak which spanned May 20 to May 26, 2011. This storm system crossed the Midwest and into the Ohio River Valley, spawning 188 tornadoes across 21 states, in total. This outbreak caused 173 fatalities, 1,545 injuries and $2.84 billion worth of damage. [25]
The Joplin Tornado is also significant because of the damage done to critical infrastructure. City officials as well as local, state and federal emergency managers had to work to restore basic utilities and healthcare capabilities to the city while also clearing debris. [26] FEMA reported that it had provided an estimated $174 million in federal assistance provided through various programs to aid the recovery. [27]
The Joplin Tornado was the most significant tornado to strike the United States from 1996 -- 2011, but it is worth noting that severe storms (defined as EF4 -- EF5) are rare. Out of 20,755 individual storms analyzed by the SNRA team from 1996 -- 2011, there were only 112 other severe tornadoes (0.54% of the total number of tornadoes). [28] These 112 severe storms were responsible for a significant share of damage. From 1996 to 2011, severe storms resulted in 45% of the total amount of damage. They were also responsible for 52% of the total number of fatalities and 41% of the total number of injuries. This suggests that even though the frequency per year is low, the risk of severe storms is high.
However, even significant storms (rated EF2 to EF3) are responsible for a large portion of the damage from tornadoes, mainly because there are significantly more EF2 and EF3 storms. From 1996 to 2011, 10% of all tornadoes were rated as EF2 to 3 (compared to 0.54% of severe storms at EF4 to 5). The 2,144 EF2 and EF3 tornadoes were responsible for 37% of the total amount of damage. The significant storms caused 43% of the total number of fatalities and 48% of the total number of injuries. Even though the majority of tornadoes are weak (there were 18,499 EF0 and EF1 tornadoes, or 89% of all tornadoes in the data set), the majority of the damage from tornadoes comes from significant and severe storms.
While powerful storms like the Joplin tornado do pose a significant threat, they very rarely appear alone. [29] By clustering tornadoes, the SNRA team was able to gain a clearer picture of the regional impact of storm systems that hit vulnerable areas. This clustering method illuminated information from serious outbreaks, such as the outbreak that occurred from April 22 -- 28, 2011. In April 2011, the United States was hit by an unprecedented number of tornadoes. There were 752 [30] tornadoes reported during the month of April alone, and this significantly outpaced the previous record of 540 [31] tornadoes in May 2003. From April 22 -- 28, there were 382 tornadoes that struck 21 states, resulting in 316 fatalities, 3125 injuries and $4.7 billion in damage. The most significant and deadly tornadoes struck Alabama, Mississippi and Tennessee from April 26 -- April 28. Of the 316 fatalities, 234 were in Alabama, 32 were in Tennessee, 31 were in Mississippi, 15 were in Georgia, and 4 were in Virginia.
This outbreak ranks with the 1974 Super Tornado Outbreak [as the most severe outbreak to strike the United States since 1950, when the data was consistently measured] and resulted in more deaths than the 1965 Palm Sunday Outbreak. [32] According to the service assessment released by the NWS:
The deadliest part of the outbreak was the afternoon and evening of April 27, when a total of 122 tornadoes resulted in 313 deaths across central and northern Mississippi, central and northern Alabama, eastern Tennessee, southwestern Virginia, and northern Georgia� there were 15 violent (Enhanced Fujita Scale 4 or 5) tornadoes reported. Eight of the tornadoes had path lengths in excess of 50 miles. [33]
The service assessment conducted in-depth research into why the fatality numbers were so high during this outbreak. Contributing factors to the high number of casualties included:
The large number of severe tornadoes played a crucial role in the high fatality rate. As Kevin Simmons and Daniel Sutter explain,
�insuring residents receive a warning and take shelter in an interior bathroom or closet will not prevent fatalities because these rooms often fail to protect residents from an EF4 or EF5 tornado. In addition, the longer a tornado remains on the ground, more structures and people are placed at risk. To address this threat, engineers have developed safe rooms and underground shelters capable of protecting residents from even the strongest tornadoes. When a significant event occurs, there is enhanced interest and some political pressure to increase the use of shelters. However, violent tornadoes are just too rare to make hardening millions of homes in tornado-prone states cost effective [35].
According to the data clustered by the SNRA model, there were 12 EF4 tornadoes and 4 EF5 tornadoes during the outbreak, or 4% of the 382 tornadoes in the outbreak. [36] These violent tornadoes were responsible for 277 fatalities (or 88% of fatalities), 2675 injuries (or 86% of injuries), and $4.2 billion in damage (or 90% of damage).
The prevalence of severe storms during this outbreak led to widespread damage. The combination of high fatalities along with the damage to critical infrastructure such as the electricity grid prompted governors in several states (Alabama, Arkansas, Kentucky, Mississippi, Missouri, Tennessee and Oklahoma) to declare a State of Emergency.
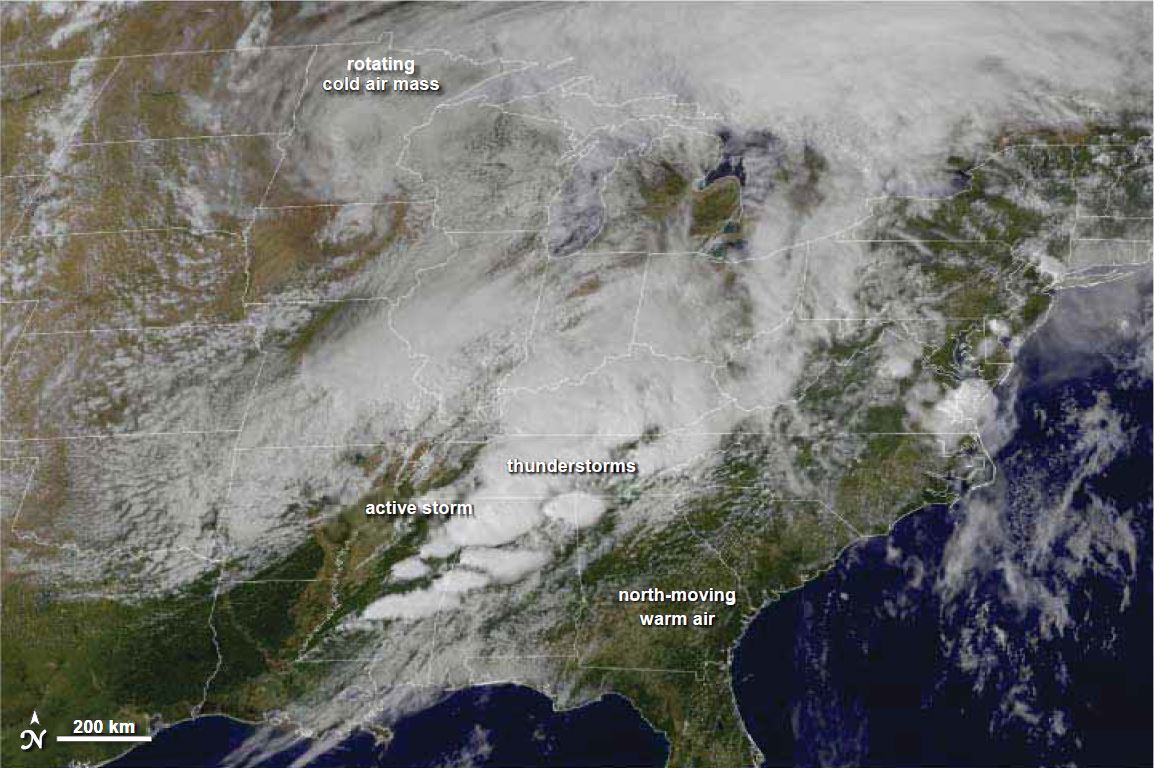
Figure 2 - The Southern U.S. on 27 April 2011 (NASA Earth Observatory, 2011)
In 2007, NOAA began to classify tornado damage using the Enhanced Fujita scale (EF scale). The previous Fujita (F) scale "did not include damage indicators (DIs) and did not provide a method to correlate construction quality with the observed variability in damage resulting from similar wind speeds. Therefore, in 2004 the EF Scale ratings were adopted and provide a more rigorous and defensible metric for the severity of tornadoes." [37] The EF scale allows for a
...more precise and robust way to assess tornado damage than the original [Fujita scale]. It classifies F0-F5 damage as calibrated by engineers and meteorologists across 28 different types of damage indicators (mainly various kinds of buildings, but also a few other structures as well as trees). The idea is that � a tornado scale needs to take into account the typical strengths and weaknesses of different types of construction. This is because the same wind does different things to different kinds of structures. In the EF scale, there are different, customized standards for assigning any given F rating to a well built, well anchored wood-frame house compared to a garage, school, skyscraper, unanchored house, barn, factory, utility pole or other type of structure. [38]
Table 3 - Fujita Scale Conversion (Mitigation Assessment Team Report, 2012)
| Fujita Scale Converted to EF Scale | |||
| F0 | 45-78 | EF0 | 65-85 |
| F1 | 79-117 | EF1 | 86-110 |
| F2 | 118-161 | EF2 | 111-135 |
| F3 | 162-209 | EF3 | 136-165 |
| F4 | 210-261 | EF4 | 166-200 |
| F5 | 262-317 | EF5 | Over 200 |
| mph = miles per hour; EF = Enhanced Fujita | |||
At this point in time, NOAA has not gone back to reassess the previous Fujita scale classifications for tornadoes, making the assumption that the Fujita scale data is aligned as closely as possible with the EF scale. The SNRA team agreed with this assertion.
"Tornado Alley" has long been a colloquial term to describe the most tornado prone regions in the United States, which can "shift dramatically across the space between the Rocky and Appalachian Mountains." [39] Tornadoes have occurred in every state as well as the District of Columbia and Puerto Rico since 1996, and during the 1996 -- 2011 timeframe, there were on average 406 tornadoes per state. The District of Columbia had the lowest number of tornadoes with only one tornado reportedly passing through DC, while Texas had the highest proportion of tornadoes with 2,282. This is in large part due to its juxtaposition between the Great Plains and the Gulf of Mexico, as well as its large geographic size.
Meteorologists are researching an eastward shift in the number of tornadoes. [40] Walker Ashley, a meteorologist at Northern Illinois University, notes that the increased number of tornadoes in the mid-south states (particularly Alabama, Tennessee, Mississippi and Arkansas) from 1996 into the 2000s pose a threat to residents of those states. He argues that "while the �tornado alley� region of the Great Plains boasts the most frequent occurrence of tornadoes, most tornado fatalities occur in the nation�s mid-South region, which includes parts of Arkansas, Tennessee, Alabama and Mississippi." [41] There are a number of factors that make the mid-southern states vulnerable to tornadoes:
1. The data reported in this table represent historical U.S. tornado data. The SNRA project team used historical data from the Storm Prediction Center (SPC) online database. The SPC is a division of the National Weather Service (NWS), which is a part of the National Oceanographic and Atmospheric Administration (NOAA).
2. Social displacement, psychological distress, and environmental impacts of tornado outbreaks were not assessed for the Tornado event. Expert elicitations and research for these metrics were completed during the main project phase of the SNRA (summer-fall 2011) before the tornado event was added in 2012. These measures will be assessed in the next iteration of the SNRA.
3. Low, best, and high estimates for fatalities, injuries and illnesses, and direct economic loss come from the low, average, and high values of the set of events meeting a $100 million threshold of direct economic cost. This set came from the National Weather Service�s Storm Prediction Center database on tornadoes ranging from 1996 - 2011. For further details see Assumptions sections below.
4. This is the low estimate when the $100 million threshold is applied.
5. Environmental impact estimates were elicited from subject matter experts in 2011, prior to the addition of the Tornado hazard event (2012).
6. Frequency estimates correspond to the inverse of the number of years of the longest interval between accident events (low), the mean frequency of the accident events (best), and the greatest number of accidents within one year (high) of the set described in note 1 above.
7. (Edwards, The Online Tornado FAQ, 2012)
8. This is based on number of tornadoes per year from 1996 -- 2011. All calculations are taken from the SPC database.
9. On September 24, 2001, a tornado originated in Virginia and passed through Washington DC. The individual entry for DC was removed during data consolidation. The tornado ID number is 11594 (entry in the NOAA SPC database is 2001 -- 451).
10. All units of time have been converted to central standard time (CST).
11. The day window accounts for a 47 hour and 59 minute span of time. For example, a day window would associate a tornado that struck at 00:00 on January 1, 2011 and one that struck at 23:59 on January 2, 2011.
12. An event was spatially associated with a previous event if it comes within 150 miles of the path taken by the previous event.
13. Available definitions that are spatially precise may be nebulous in time, or vice versa. Moreover, many historical attempts to define the term "tornado outbreak" have failed to account for the spatial outliers, far removed from tornado clusters but within the same time domain. (Edwards, Thompson, Crosble, & Hart, 2004)
14. To judge the distance, the SNRA project team used several data fields from the SPC database. First, using the starting and ending latitude and longitude, one can establish the exact origin and termination points of the tornado. For the purposes of the analysis, the algorithm uses the midpoint C of a straight line between the starting point A and terminating point B. If two tornadoes were within 150 miles AND one day of each other at points A, B, or C, they would be clustered.
15. The average path length of a tornado in the data set is 3 miles and the average maximum width is 113 yards. Due to the short average path length and width, the starting, ending and midpoint were assumed to be sufficient points of measurement from which the 150 mile distance is determined.
16. Note that a single tornado can be its own cluster if no other tornadoes in the data set meet the spatial and temporal criteria.
17. Geographically, the data set spanned all 50 U.S. states as well as Puerto Rico and the District of Columbia.
18. The economic damage of the tornadoes in the threshold totaled $20,721,128,120.
19. The average number is found by dividing the total number of tornadoes that were part of an outbreak (2811) by the number of outbreaks (44).
20. Prior to 1996, the SPC database used a logarithmic scale to provide a range of estimated loss. According to the information sheet that accompanies the database, it was "a categorization of tornado damage by dollar amount (0 or blank-unknown; 1<$50, 2=$50-$500, 3=$500-$5,000, 4=$5,000-$50,000; 5=$50,000-$500,000, 6=$500,000-$5,000,000, 7=$5,000,000-$50,000,000, 8=$50,000,000- $500,000,000, 9=$5,000,000,000.)" (NOAA NWS SPC, 2012)
21. The SPC began separating crop and property damage in 2007. Where available, the fields have been combined to reflect the direct economic damages.
22. The Tornado national-level event was added to the SNRA in calendar year 2012, subsequent to the main project phase of the SNRA in summer-fall 2011 when the expert elicitations and research for the social displacement, psychological distress, and environmental impact measures were completed. These measures will be assessed for all events in the next iteration of the SNRA.
23. (Storm Prediction Center Warning Coordination Meteorologist, 2011)
24. (The Associated Press, 2012)
25. (Storm Prediction Center Warning Coordination Meteorologist, 2011)
26. (State Emergency Management Agency, 2011)
27. (FEMA, 2011)
28. From 1996 -- 2011, there were 99 EF 4 tornadoes (or 0.48% of the data set) and 13 EF 5 tornadoes (or 0.06% of the data set).
29. In fact, as noted above, the Joplin tornado appeared as part of a cluster. The SNRA project team chose to highlight it because of its infamy and its severe consequences.
30. Based on data from the SPC database. NOAA released the tornado count of 751 tornadoes for the month of April 2011 in its Special Report, but there was a discrepancy between the number of tornadoes (752 in SPC database and 751 in the special report). Therefore, the SNRA team used the SPC database figures. (National Climatic Data Center, 2011)
31. Based on data from the SPC database. NOAA released the tornado count of 542 tornadoes for the month of May 2003 in its Special Report, but there was a discrepancy between the number of tornadoes (540 in SPC database and 542 in the special report). Therefore, the SNRA team used the SPC database figures. (National Climatic Data Center, 2011)
32. (National Weather Service, 2011)
33. (National Weather Service, 2011)
34. (National Weather Service, 2011)
35. (Simmons & Sutter, 2012)
36. There were 382 tornadoes clustered in this outbreak. 4% of the storms were violent (EF4 -- EF5).
37. (Mitigation Assessment Team Report, 2012)
38. (Edwards, Thompson, Crosble, & Hart, 2004)
39. (Dixon, Mercer, Choi, & Allen, 2011)
40. This eastward shift into the mid-southern states is subjectively defined as "Dixie Alley." See Dixon, Mercer, Choi, & Allen, 2011.
41. (Parisi, 2008)
42. The following factors are based on analysis done prior to 2008.
43. Storm spotters play an important role in identifying tornadoes. Over 30 years ago, the National Weather Service (NWS) developed SKYWARN, a program that "encourages communities to develop a network of trained storm spotters who provide detailed reports of dangerous weather conditions to their local emergency management agency and to the NWS." (National Weather Service, 2012)
44. (Parisi, 2008)
45. (NOAA National Severe Storms Laboratory, 2012)
46. (NOAA National Severe Storms Laboratory, 2012)
47. (National Weather Service, 2012)
48. (National Weather Service, 2012)
49. (Coleman, Knupp, Spann, Elliott, & Peters, 2011)